Uploading to Servers
Sending Data to a Web Service
As a standalone unit, IoTaWatt is a very capable data logger with an integrated web server/API interface. It can provide real-time as well as historical data, using the provided status-display and the powerful Graph+ application.
That said, there are limitations. While the web server typically serves clients on the local network, remote access requires port forwarding and dynamic DNS to access from outside.
There are cloud based services available that will store uploaded data logger information and present that data to client applications across the internet. Some of those databases can also be installed on a private server hosted by anything from a Raspberry Pi to a commercial hosting service. IoTaWatt has the capability to upload selected data while still maintaining all of its own local logging and reporting capabilities.
When one of these services becomes unavailable for any reason, IoTaWatt will upload the backlog when service is restored, whether that backlog is a minute or a month.
IoTaWatt can support multiple upload services simultaneously, so it’s not necessary to sacrifice uploading to an influxDB database in order to participate in the PVoutput project.
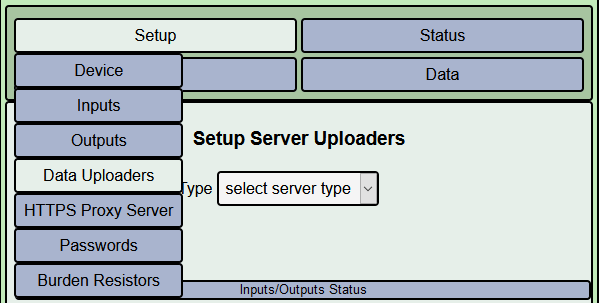
To initiate configuration of any web server uploader, hover over
 and select
  .
.
click the Web Service: dropdown and select a server you would like to use from the dropdown list. Each service is designated as
(add) - New service specification
(edit) - modify existing service configuration (including delete)
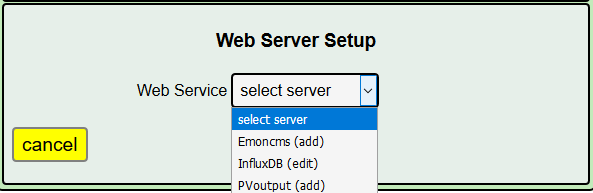
When you select a server, the configuration menu for that particular server will appear. For details of configuring each unique server type, click on the heading of the corresponding section below.
PVoutput
PVOutput is a free online service for sharing and comparing photovoltaic solar panel output data. It provides both manual and automatic data uploading facilities.
Output data can be graphed, analysed and compared with other PVoutput contributors over various time periods. The ability to compare with similar systems within close proximity allows both short and longer term performance issues to be identified.
While pvoutput is primarily focused on monitoring energy generation, it also provides equally capabable facilities to upload and monitor energy consumption data from various energy monitoring devices.
Both solar generation and energy consumption data can be combined to provide a live ‘Net’ view of energy being generated and consumed.
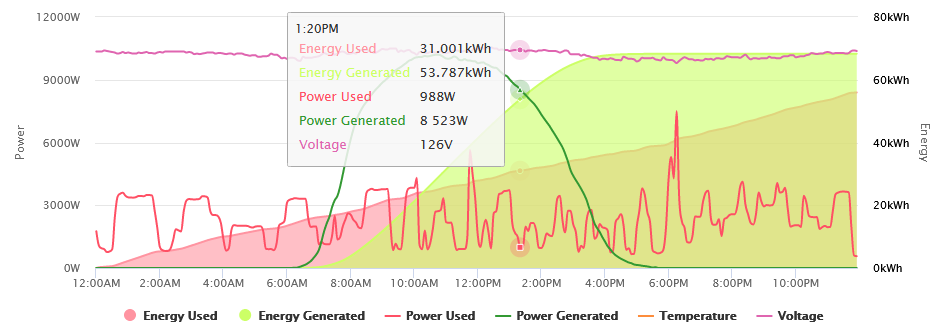
PVoutput Graphic Display
influxDB
influxDB is a free industrial strength, open-source, schema-less time series database. It is fast, efficient and scalable. You can install on a Raspberry Pi, a home server, or a commercial web host site.
There are several excellent visualization packages that can be used to visualize and report the data.
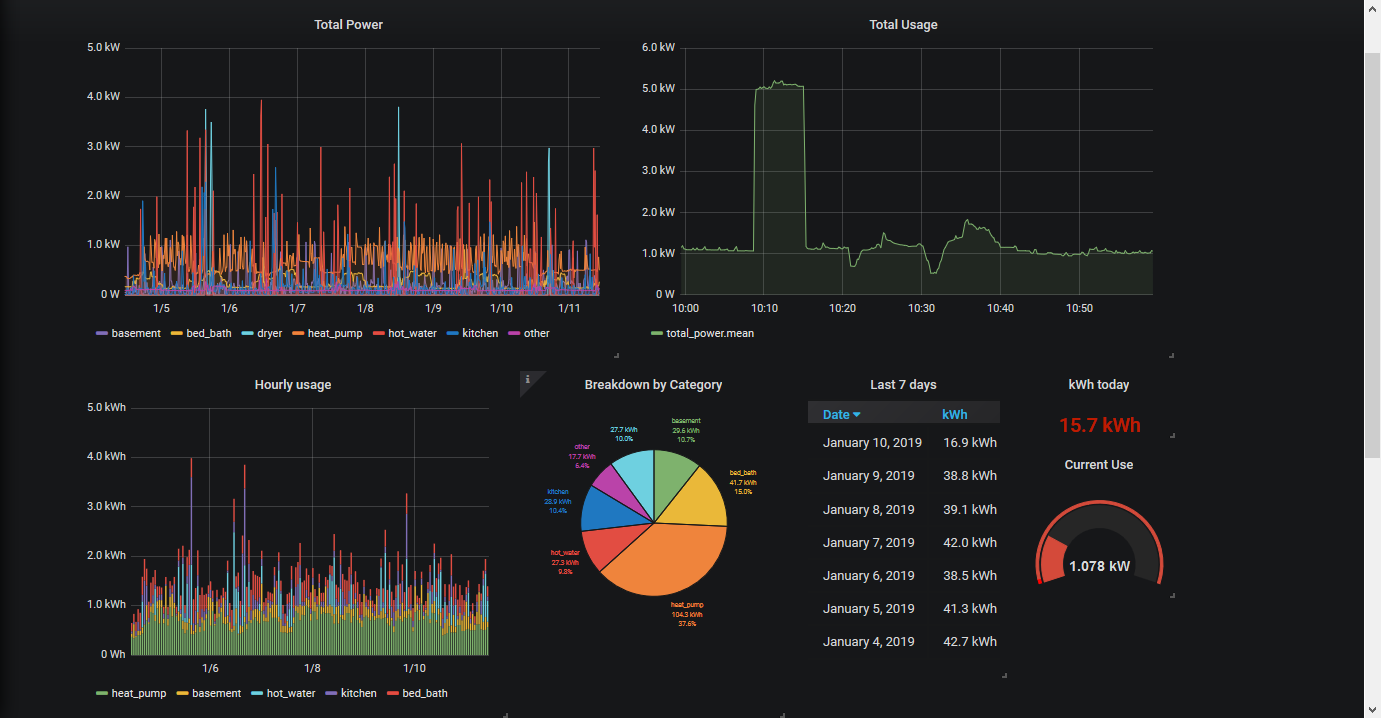
grafana dashboard with influxDB
Emoncms
Emoncms is another open-source time series database that was specifically designed to handle energy monitoring data with robust set of visualization tools.

An Emoncms Dashboard
Like influxDB, it can be local hosted on almost any machine, including Raspberry Pi, but also is available as a relatively inexpensive pay-as-you-go cloud service at emoncms.org.