Device Status Display
Overview
The configuration app can provide a continuously
updating display of many aspects of IoTaWatt operation.
The output is organized into expandable tabs containing
various categories of information.
Simply click the  button.
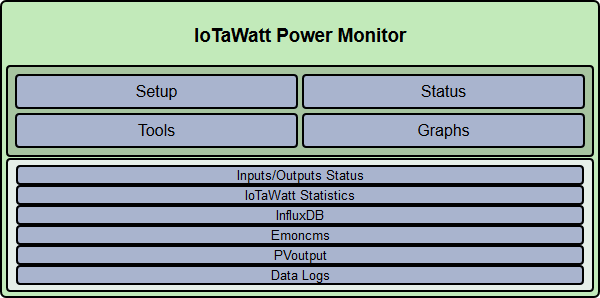
The initial display will always have the Inputs/Outputs Status tab expanded. Simply clicking on that tab, or any of the other tabs, will toggle them between expanded and collapsed. The various tabs as of this writing are detailed as follows:
Inputs/Outputs
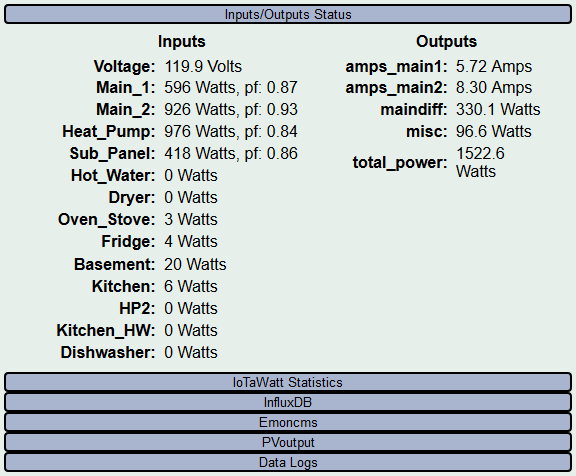
This tab lists all of the configured input channels on the left, and all of the defined outputs on the right. Both columns show the current measurement value. Input channels values are in Watts or Volts for CT and VT channels respectively. CT channels also will display the power-factor (PF) when the power is sufficient to develop that reliably. Output channel values are in the units configured. They may be Volts, Watts, Amps, VA, Hz, or PF. All values are damped, which is to say they are averaged with an exponential decay algorithm so that they will not jump around excessively. That said, the algorithm does respond to large changes quickly and settles in on small changes within a few seconds.
Statistics
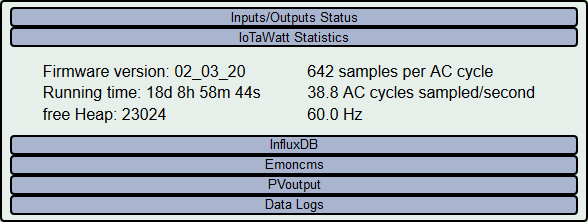
The statistics tab provides insight into the current operation of the IoTaWatt with the following information:
- Firmware version: Release of IoTaWatt firmware.
- Running Time: Since last restart.
- free Heap: An indication of the working memory available to the firmware.
- Samples per AC cycle: Average samples IoTaWatt is achieving when sampling a channel.
- AC cycles sampled/second: Average number of channels that are measured per second.
- Hz: Current AC frequency.
Web Servers
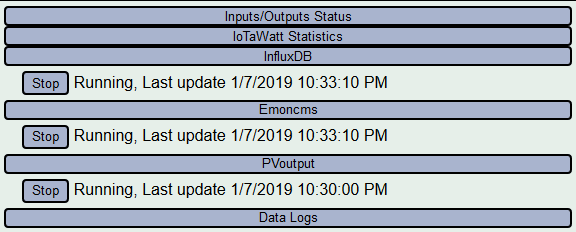
These tabs appear when data upload to PVoutput, Emoncms, influxDB has been configured. They indicate the state of the services that are responsible for sending the data to the respective server.
Start/Stop button: Use to pause and resume uploading data. This button works asynchronously, and may take awhile to perform the action. Pressing multiple time may cause it to go out of sync. Use it carefully.
Running/Stopped: The current state of the service.
Last Update: Data/time of the last data sent to the server.
Data Logs
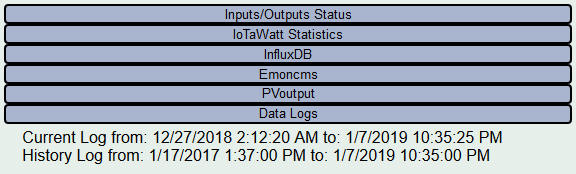
This tab displays the date/time of the first and last entry in both the Current Log and the History Log. These dates may take a few seconds to become accurate as the IoTaWatt starts. The History Log should begin from the data/time when the IoTaWatt was first installed, or when the History log was last created after being deleted. It should increment every minute while the unit is running.
The Current Log contains up to a year’s worth of data, and maintains that data at 5 second resolution. When the approximate year capacity is reached, it will “wrap” back around and begin writing over the oldest entries. Newer logs will show the same start date as the History Log. As the log ages and reaches capacity, the start date/time will advance at 5 second intervals along with the ending date/time.